Category: Dataphile Posts

Root category for site posts

  • Origins of the Industrial Revolution

    Origins of the Industrial Revolution

    The invention of the steam engine may be considered as the turning point that triggered the industrial revolution. It enabled massive productivity gains as well as the ability to scale industry from small workshops to large enterprises producing goods at scale. Other key technologies make up the industrial landscape today, such as electricity, transport, etc, but the steam engine was the first key technology that determined a particular path for the development of the industrial society.

    England in the 1700s

    What was special about England in the 1700s – a cold, damp island with nothing very remarkable?

    What were steam engines

    The first steam-driven mechanical devices widely used were Newcomen Atmospheric Engines, or Fire Engines invented in 1712 by Thomas Newcomen. They were widely deployed but not very efficient. The improvement patented by James Watt is generally considered the first general purpose steam engine, and the trigger of the industrial revolution. The Watt engine was more efficient (double the work per energy input) but also more general-purpose as it rotated a shaft rather than driving a pump.

    The technology and the innovative process are interesting, but what concerns us here is – what was the problem that Newcomen and Watt were trying to solve?

    The Newcomen engine was designed specifically to pump water from coal mines. England was, as we have noted, a cold and damp place. England needed coal but the coal mines would flood easily and pumping water from the mines would mean that you could dig deeper and get more coal.

    In other words, the engine was not designed as a general purpose power source for the coming industrial revolution. It was a technical solution to an immediate problem of digging up coal.

    In fact, Watt’s use of the patent system significantly slowed down the improvements to the steam engine that would enable its use in other applications, such as transport (steam trains and ships). Widespread use of steam engines did not really take off until the 1800s, after Watt’s patent expired.

    Why did England need so much coal?

    To get back to what concerns us here, why was the steam engine needed in the 1700s in England and not in some other place or some other time?

    In the 1700s, there were no steam engines except those used for pumping water from coal mines. So what was all the coal for?

    England needed coal principally for two things: heating and iron. Iron smelting, in particular, uses large quantities of heat to reduce ore to metal. And iron was in demand for many uses, including military uses.

    But…humans had been burning stuff for heat for a long time and smelting iron for at least 3000 years. The primary fuel sources for these activities were wood and charcoal (produced from wood). Coal is relatively difficult to acquire since one need to dig it up, a time-consuming and labour-intensive process compare to gathering wood.

    The problem was that in the 1700s, England had a shortage of wood for use as an energy source.

    Deforestation in England

    In pre-historic times, England was probably covered with thick forests. However,

  • Where do Numbers Come From?

    Where do Numbers Come From?

    Although numbers and mathematics seem to exist as features of the natural world, they are concepts that humans have created to model and understand the world and to do useful things by manipulating our natural environment.

    How do our brains process numbers?

    I remember learning a long time ago that pre-literate cultures and languages had no words for numbers. They were limited to counting one, two, lots. In fact, this is not just a feature of pre-literate cultures and languages. All living languages have the same limitation and this is a reflection of how our brains have evolved.

    Languages, all over the world, have a gramatical concept for singular and for some type of plural expression. For example, in English we usually indicate plurals with -s endings (there are several examples in this sentence). Other languages do the same thing in different ways, either by altering the word, or by adding prefixes or suffixes. For example, in German the article changes from das to die and the form of the noun changes. A small number of languages also have a concept for three things, with special endings or forms of words.

    Many languages also have a special form for two things. In English, we have words like both or pair (borrowed from French). We also have words for many things which may be a lot (many) or not (few).

    The complete range of number concepts in all known languages is:

    • One (singular)
    • Two (dual)
    • Three (trial)
    • Few (paucal)
    • Many (plural)

    This concept seems to be something hard-coded in our brains. We can instantly recognise whether there are 1, 2 or many objects without any effort or counting, but almost no one can instantly recognise groups of more than 5 objects unless they are arranged into familiar patterns that we have learned.

    Tallying

    The first evidence we have of people trying to track a large number of objects is tally systems. These are seen on rock paintings and tally sticks dating back at least 25,000 years. Only 25,000 years! Before then, fully evolved humans, using language, fire, tools and clothing, don’t seem to have needed to keep track of objects.

    There is nothing to tell us how the tally sticks were used. We can make up stories about early trading or credit systems, or other uses, but all we can assume with confidence is that one notch on the tally stick represented 1 thing in the real world. This is the first level of abstraction – using symbols to represent objects in the real world.

    Although we can’t know for sure, people were probably also using tally systems based on their hands and fingers. These systems have survived into modern times and can become quite sophisticated, representing numbers much larger than 5 or 10.

    Counting

    At some point, people started to represent different numbers of tally marks with their own concepts. i.e. they started to use numbers like “one”, “five”, “eight”, and to put them in order.

    In his Introduction to Mathematical Philosophy, Bertrand Russel spends chapters discussing the meaning of the number 1 and how it should be followed logically be the number 2, and so on. For a concept that appears obvious to us today, it doesn’t seem to be at all obvious why numbers should exist at all.

    If you think about it, counting is a dramatic step in abstracting numbers from reality. It implies that 5 is always 5, regardless of what you are counting. 5 sheep is “the same” as 5 fish. If I have 5 sheep and another one comes along, then I have 6 sheep. And exactly the same things happens with those fish!

    • 5 sheep and 1 sheep makes 6 sheep
    • 5 fish and 1 fish makes 6 fish
    • 5 + 1 = 6. Always! Regardless of what you are counting.

    It’s not obvious because 5 sheep and 1 fish doesn’t make anything interesting. The abstraction only makes sense if you consider numbers as a different entity from the things they might represent.

    Once the abstract concept of numbers had been accepted, the rest of mathematics followed relatively quickly, although it still took centuries to absorb concepts such as zero, negative numbers, irrational numbers and so on.

    So, where do numbers come from?

    Numbers are not obvious in nature and not wired into our brains, Numbers and mathematics are human inventions that we use to model the world and do useful things such as measuring and calculating. Even though mathematics has been extremely (unreasonably?) powerful as a tool to model the real world, there are no numbers out there in the world, independent of the concepts we have created in our brains.

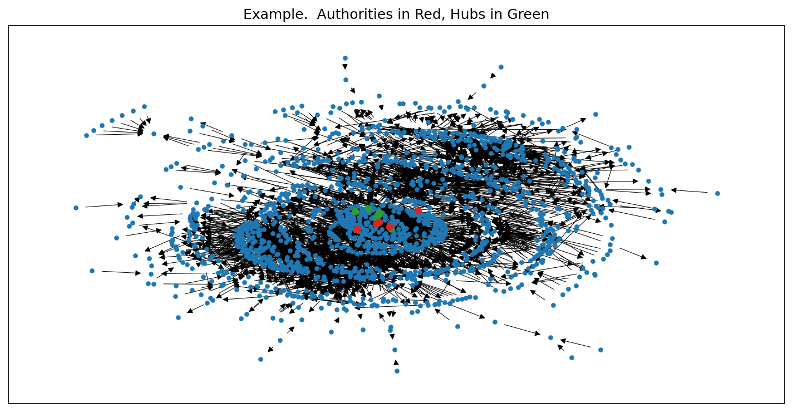
  • Patent Citation Analysis

    This project analyses data from the US patent citation database. Patent citations are interesting because they have been shown in several studies to be indicators of the value of patents. Previous studies have mainly used traditional data analysis techniques (simple counts of citations). The present study uses network analysis techniques borrowed from social networks and web analysis tools such as the PageRank algorithm. The purpose is to see whether these techniques can be used to better analyse patent citation networks.

    The Data 

    We use patent citation data from US patent citations covering the period 1976 to 2006. The data is available from the National Bureau of Economic Research (NBER) at https://sites.google.com/site/patentdataproject/Home/downloads.

    The data is a simple list of node pairs (citing, cited) where each node is a US patent document.  This can be used to construct a directed acyclic network (DAG).

    Patent citations are interesting because patent documents represent new technological solutions to industrial problems.  Patent applicants and examiners are required to cite related documents as part of the patent granting process.  This means that citations are a good indicator of links between related technological innovations.

    A secondary dataset available at NBER (pat76_06_ipc) includes technology classifications which are manually assigned by patent examiners.  This dataset can be used as a reference for identifying different fields of technology.  There are more than 200,000 possible technology classifications used by examiners, but the classification system is hierarchical and so one can choose a level at which there are around 1000 classification groups that represent high-level technologies such as “pharmaceutical compounds”, “electrical components”, etc.

    There are limitations to this dataset. It is relatively old and it only covers US patents. However the purpose is to show how network analysis can be used, not to derive specific insights from more recent patent data.

    The data was first analysed in Hall et al. (2001) in a paper which looked at some of the characteristics of the data and proposed some methodological solutions to problems such as citation lags and publication delays that skew the data in certain ways.

    In 2001, the algorithms and computer resources for large network analysis were relatively limited and so no network analysis was done.  Since then, other authors have applied more advanced techniques, however in the context of this project we will not do a full literature review.

    Research Questions

    We will explore some questions to see what patent citations can tell us about the structure of innovation.

    First, we will characterize the dataset and compare it with other similar datasets to answer the following questions:

    • Is the network connected and how do its connectivity and clustering compare with other similar networks?
    • What is the degree distribution of the network?  Does it follow a power law and how does this compare with other similar networks?

    Then we will attempt to answer some questions to explore what the citation network can tell us about the nature of innovation.  The following question will be asked:

    • Can the patent citation network be used to group similar patents into communities?
    • Do these communities accurately represent technologies?
    • Are different technologies more or less connected?  This question is intended to identify whether some technologies consist of inventions that are more or less independent, or whether innovations tend to be highly inter-connected.  This can have policy implications.  For example, highly crowded fields are likely to be very competitive and incur costs for litigation and cross-licensing.  Efficiency can be improved by policy interventions that encourage patent pooling or cross-licensing.
    • Are there spill-over effects from one technology to another?  This question is also interesting from a policy perspective because it may be a measure of how new ideas diffuse through society and stimulate further innovation in unrelated areas.
    • Can we identify foundational patents which represent a major step in a technology?  This information may be interesting to estimate the commercial value of a patent, for example.

    Methodology

    The data is loaded into a directed graph using the networkx python library.

    Connectivity is measured by parsing the network for the number and size of connected components.

    Clustering uses the average clustering coefficient which measure the number of triangles as a proportion of the number of connected triplets.

    To measure the mean in-degree and out-degree, we use the networkx library to calculate:

    $$k_{out} = \frac{1}{n} \sum_{i=1}^{n}k_{i}^{out}$$

    We then move on to community detection.  The Louvain community detection algorithm iteratively joins nodes into larger and larger communities, finding the grouping at each iteration that maximizes modularity.  Modularity is a measure of how nodes in the same group are affiliated:

    $$M = \frac{1}{2m} \sum_{i,j} \left(A_{ij} – \frac{k_ik_j}{2m} \right) \delta \left( t_i, t_j \right)$$

    Modularity will give us a good indication of the degree of connectedness within and between the communities.

    To test whether the Louvain communities represent technologies, we will look at the distribution of technology classifications in the communities vs the population of all patents (see the description of technology classifications above).  This will be done with a simple multinomial probability test for each of the detected communities.  If successful, we can then say that a Louvain community represents a group of technologically-related patents.

    Finally, we can use Hubs and Authorities to identify important or foundational patents in each community.  In the hub/authority model, an authority is a node which contains important information, and a hub is a node which is important because it points to important nodes.  An authority is pointed to by many hubs, and a hub points to many authorities.

    Results of Characteristic Tests

    Data was loaded from the NBER citation dataset and used to create a DAG.  The following characteristics were observed.

    • Nodes: 3,155,172
    • Edges: 23,650,891
    • Average clustering coefficient: 0.0497
    • Mean in-degree: 7.496
    • Mean out-degree: 8.496

    Nodes have high in- and out-degrees, but the clustering coefficient is quite low.

    Statistics were also collected on the connectivity of the network:

    • Number of Connected Components: 2221
    • Count nodes in the largest 20 components:
    • [6, 6, 6, 6, 6, 6, 6, 6, 6, 6, 6, 6, 6, 6, 6, 6, 7, 8, 10, 3150114]
    • 99.2% of all the nodes are in one very large component.

    The degree distribution was computed for each node and then modelled using the power law distribution:

    $$p\left(x\right) = x^{-\alpha}$$

    For this network, we measured the power law alpha parameter as : 2.96

    The graphics below show that the degree distribution is visually linear on a log-log plot, which indicates a good power law fit.

    Compare these results with the table from Newman (2010) which show typical values for a variety of different networks:

    For comparison, the NBER patent citation network has the following characteristics:

    NetworkTypenmcSLaC
    Pat CitDirected3,155,17223,650,8917.496 8.4960.992 2.960.0497

    Preliminary Conclusions

    This network is very similar to other directed networks such as academic citations or the internet.  It is highly connected, and follows a power law degree distribution.  It is not highly clustered, but this is typical of similar directed networks which do not tend to have triangular relationships, partly because they are acyclic.

    This conclusion shows that we have a typical directed acyclic network with no obvious defects and we can continue with some more advanced analysis.

    Results of Community Detection

    The Louvain community detection algorithm was run.  This results in a partition of the network with the following characteristics:

    • Number of communities: 2267
    • Average community size: 1392
    • Modularity of partition: 0.803

    This already indicates that the algorithm was able to detect a high-level structure in the data with a high modularity.  The average is not a good measure of the distribution, which is very skewed with a large number of communities with only 2 nodes, and a maximum of 241,598 nodes in the largest community. 

    We now need to test whether the Louvain communities actually correspond to high level technology classifications.  To do this, we compare the distribution of technology classifications in the sample communities with the overall population distribution.

    Recall that the technology classifications are assigned by patent applicants and examiners, similar to a library classification system.  They are symbols such as ‘A61K’ (Pharmaceuticals), ‘H01L’ (Semiconductors), etc.  We can extract these symbols from the NBER patent dataset, compute the population probability for each symbol, and then compare these with the samples from the Louvain communities.

    This is a multinomial probability calculation – “what is the probability of drawing this sample distribution from the population distribution?”.

    Given the time constraints, this test has been performed on a small sample of the 2267 communities.  The multinomial probability is near zero for the cases tested, i.e. the distribution of technologies is not random, it is significant. 

    From this, we can conclude that the Louvain communities represent technology groupings and can be used to study hypotheses about a technology field. 

    Results of Hubs and Authorities

    For this test, just one Louvain community was selected, with a size of 1434 nodes.  The networkx HITS library was used to analyze hubs and authorities within this subgraph.

    The HITS algorithm finds authorities (should contain important information) and hubs (should point to important authorities).  The results from analysing the chosen subgraph are:

    Top hubs in subgraph: [(7071390, 0.0052019841605045235), (6982366, 0.005200033113645647), (7071389, 0.005187275821457385), (7119258, 0.005179310165831523), (7005564, 0.0051723889076598405)]

    Top authorities in subgraph: [(5523520, 0.1602980087442528), (5367109, 0.14231195658948897), (5304719, 0.13996625528001524), (5850009, 0.13300081298227423), (5968830, 0.08253520695546829)]

    The first item in the list is a patent number followed by the hub/authority scores.

    The plot of the community shows the hubs and authorities at the centre of the sub-network.  One can also observe several concentric layers in the sub-network, which may indicate generations of innovation as the technology develops over time.

    The algorithm seems to find patents that are relevant and important.  The sample contains patents related to plant breeding technologies.  For example, one of the key authorities is patent US5367109 – Inbred corn line PHHB9.  The example can be seen here: https://patentscope.wipo.int/search/en/detail.jsf?docId=US38313870

    This node has an in-degree of 175, indicating that it has been cited many times, which supports the assertion that it is an important foundational innovation.

    The plot below shows a relatively small community with only 31 nodes.  This is reproduced here to show a typical structure of the network at a very low level.

    Conclusions

    We have shown that patent citation networks have similar structure to comparable networks such as academic citations or web pages.  We have measured in-degree, out-degree, degree distribution, connectedness, clustering.  The conclusion is that patent citation networks are well structured and well suited to further analysis.  Clustering analysis was not relevant since this kind of network is not highly clustered by its nature.

    We then used Louvain community detection to partition the network.  According to the multinomial statistical test, this partitioning created communities with patents in similar technical fields.  The modularity metric for the Louvain partitioning was very high, indicating that the communities were tightly inter-connected with relatively few linkages to other communities.  This allows us to draw some tentative conclusions about the nature of technological development – namely that there is a lot of information circulating within a technology field, but not a high degree of spillovers of technological information into different technical fields.

    Finally, we were able to use the hubs and authorities algorithm to identify some candidates for high-value patents within the network.  Although it was not possible to systematically evaluate these results, the samples that were chosen look like relevant and important results.

    Further Considerations

    This study is an initial analysis of patent citation networks using modern network analysis. It has shown that further work may be productive.  The following could be considered:

    • The citation data is not sufficient to identify technology domains because the Louvain communities are quite unevenly distributed.  It would be better to use more data and train a classifier using other methods, perhaps including the citation data as one feature.  We would not use the Louvain algorithm to partition the data, but we could still measure modularity to learn about the partitioning.
    • It would be interesting to look at characteristics of different technology fields.  For example, do some technologies have higher degree nodes, indicating more inter-connected innovations?  When do spillovers happen from one technology field to another. 
    • What is the time dimension of the evolution of the network?  Has it become more connected, has the degree distribution changed, etc?
    • Can the study be expanded beyond US patents?  Can we learn about the development of technologies in different countries, compare their strengths and weaknesses, and look for evidence of collaboration or spill-over effects between countries?
  • Transition to Clean Energy Vehicles in Switzerland

    Introduction

    A few years ago, I read Tony Seba’s book Clean Disruption. I got very optimistic because it seemed like the clean energy transition was starting and that we were at the beginning of an ‘s-curve’ of adoption that would result in rapid adoption of clean technologies. The transition to clean energy vehicles would mirror the transition from horses to cars that took only about 10 years in the early 1900s. Problem solved.

    10 years later, it still hasn’t happened. There is a lot of hype, and a lot of over-priced and over-engineered vehicles on the market. Where are all the electric cars anyway? When I stop at a motorway rest stop, all the Tesla superchargers are vacant. There is still a queue at the petrol station. Apparently the Tesla Model Y is the biggest selling car in Switzerland, but I don’t see many on the street.

    It seems like Tony Seba’s s-curve is not working as expected. So let’s get some data and figure out what’s really happening.

    The Data

    The Swiss Federal Office of Statistics publishes data on vehicle registrations broken down by various categories. I downloaded the data on the stock of vehicles by year of registration and the new registrations by motorisation type.

    Why Switzerland?

    • The data is quite good quality.
    • There are few distortions in the data. Unfortunately there are almost no incentives for clean energy vehicles so the data accurately represents personal choices and market forces.
    • Most people are not as rich as you might think, so the market shares of different vehicles are representative of European countries in general.
    • I live here.

    I have done some data pre-processing. In particular, I have combined the different types of Hybrid vehicle into 1 category (includes traditional plus plug-in hybrid, petrol and diesel variants). Within this category, the proportions are changing to favour plug-in hybrid, but overall I believe that the whole category is a transition technology that should phase out over time.

    We are only looking at passenger cars. This analysis does not consider commercial vehicles or public transport.

    The Questions

    • What are the trends in new vehicle purchases by motorisation type?
    • How fast is the transition occurring and what are the long-term projections?
    • What policy changes might the government consider?
    • How much carbon is this displacing anyway?

    First Look

    There are 9.5 million passenger vehicles in Switzerland (population 8.8 million !?) and the numbers have been increasing, although the growth rate is slowing down.

    One can observe the share of diesel surge and then decrease. Diesel is becoming less popular, but it is still an attractive option due to low running costs.

    The shares of the total stock of vehicles at the end of 2022 were:

    Petrol63%
    Diesel28%
    Hybrid6%
    Electric2.3%
    Other<1%

    Clearly, the transition is still at the very early stages of the s-curve.

    New registrations in 2022 are more encouraging. Hybrid and Electric already have 51% market share for new vehicles:

    Petrol37%
    Diesel12%
    Hybrid33%
    Electric18%
    Other<1%

    The other factor to consider is the ‘churn rate’, or the number of vehicles that are retired each year. This is shown, in percentage terms, in the figure below.

    A concern with these figures is that the churn rate for diesel is relatively low and for electric it has been relatively high. This means that, even if consumers are purchasing more electric cars, they are retiring them much earlier than their diesel cars.

    Overall, the average churn rate is 5.4% and we will use this number in the modelling below.

    Modelling and Predicting

    We will model the transition over time with 3 components.

    • First, the churn rate is used to retire 5.4% of older vehicles every year.
    • Then we predict the total number of new registrations. This is a simple least-squares regression assuming a linear trend. The trend in recent years appears more quadratic, but that may be due to a market slowdown in 2020-2022 and a quadratic regression would predict a rapid decline in new registrations. The linear fit predicts a slow linear decline.
    • Finally, we need to predict the proportion of new registrations by motorisation type.
    • Then add the components together to predict the total stock and mix of motorisation types from 2023 to 2050.

    For the proportion of motorisation types, we assume an s-curve transition for each type. To model this non-linear trend, we assume that the s-curve follows a sigmoid function. The sigmoid function is:

    $$y=\frac{1}{1+e^{-x}}$$

    This function takes any real value for x and returns a value between 0 and 1.

    First we transform our data from 0-1 values to a linear scale using the inverse sigmoid function:

    $$x=log \left( \frac{y}{1-y} \right)$$

    Then we run an ordinary least squares regression on the transformed data, predict the future values, and transform back to 0-1 values using the sigmoid function. The results are shown below:

    The predictions for market share follow s-curves as desired. No further modelling assumptions have been made here. In particular, we do not assume that the hybrid market share should decline – it’s not shown in the data so we don’t force that assumption.

    Putting it all together, we can predict the total number of vehicles by motorisation type from 2023 to 2050.

    According to this model, we reach ‘peak car’ in Switzerland in 2040 with 9.8 million cars.

    The final proportions in 2050 are:

    20222050
    Petrol63%22%
    Diesel28%10%
    Hybrid6%32%
    Electric2.3%35%
    Other<1%<1%

    The total ‘electrified’ share of the market grows from 8.3% to 68%. However, there are still 32% fossil fuelled vehicles on the road in 2050, or nearly 3.2 million vehicles.

    Carbon Neutral ?

    The EU and other regulatory agencies are setting targets for CO2 emissions for new vehicles. The current average CO2 emissions per Km are around 108 g/Km, although this figure includes full electric vehicles which have 0 emissions according to the WLTP standard (doesn’t count production emissions). The average car in Europe drives 18,000 km per year which means around 2 tonnes of CO2 per fossil fuelled car in Europe.

    We can now estimate the carbon impact of our vehicle fleet in Switzerland. We will be generous and assume that the hybrid cars achieve a 50% reduction in emissions and that full electric cars achieve 100%.

    Tonnes CO220222050
    Petrol11,964,3684,328,428
    Diesel5,277,3482,024,320
    Hybrid568,8343,154,918
    Electric00
    Total :17,810,5509,507,666

    We have a 47% reduction in direct CO2 emissions after 30 years. If we are generous and assume that hybrid cars will be totally replaced by full electric, then we could achieve 63% reductions. Not bad, but nowhere near net-zero.

    Note again, this does not take into account production emissions, electricity sources, etc.

    Reflections

    Tony Seba predicted that conventional cars would be obsolete by 2030, as well as most uses of oil, gas and coal. Not happening.

    On the other hand, the world needs to get to net-zero by 2050 and significantly reduce CO2 emissions by 2030. Passenger vehicles seem like an easy part of the equation to get right because we already have all the technology we need to make the transition. But with the current policy settings, we will still be only half-way there by 2050. And we haven’t even looked at the difficult transitions, such as commercial vehicles, electricity generation, industrial processes, etc.

    The market may even work against the transition as the demand for oil peaks and the fossil industry faces over-capacity while resource constraints make electric batteries relatively expensive. Consumers may find that it is relatively cheap to keep the old petrol or diesel car running for another 5 years instead of replacing it.

    New policy initiatives are needed:

    • Create incentives, such as steeply progressive emissions taxes, to encourage car owners to retire their higher-emission vehicles.
    • Create incentives for manufacturers to produce practical and more affordable vehicles. For example, close the loopholes in safety regulations for large SUVs; give tax incentives to lower-income buyers.
    • Moratorium on all fossil vehicles sales after 2030. Current EU regulations ban fossil vehicle sales after 2035, but the industry is lobbying to find ways to wiggle out of it.

    But the problem with an electric car is that it is a car. It is still an expensive, wasteful, over-engineered solution to carry a bag of groceries across town or drop off children at school. More cars create more congestion and inefficient transport systems. And the supporting industry creates CO2 emissions.

    In 1980, 35% of personal vehicles were motorcycles and mopeds. This dropped to 21% by 2022 but the number of mopeds (which includes speed electric bikes) increased again by 12% since 2020. This indicates a latent demand for alternative transport solutions. Electric bikes are a cheap and efficient solution for most urban transport needs, especially the cargo bike varieties that are proving to be good solutions for transporting groceries and children. A recent study shows that 280 million e-bikes in the world are already displacing 4x as much demand for oil as electric vehicles.

    E-bikes have taken off since 2020 for several reasons. Firstly, the technology has developed so that e-bikes are now relatively cheap and efficient and there are more options available, such as cargo bikes designed for families. Secondly, many cities (in Europe) have created cycling infrastructure to make cycling safer. Thirdly, the pandemic changed peoples preferences since they prefer not to use crowded public transport where the risk of transmitting diseases is higher.

    So here are the real policy initiatives that are needed, in addition to encouraging the early retirement of fossil vehicles:

    • Create dedicated cycling infrastructure in cities to make cycling a safe choice.
    • Create efficient and extensive public transport networks, including park&ride facilities to move commuters from private cars to other transport system in cities.
  • Too much data, not enough scientists

    Too much data, not enough scientists

    Data science is at the intersection of programming, mathematics and business or domain knowledge. With the recent explosion of tools and data, many people have been coming to data science from a programming or data management background, quickly learning to apply some libraries, and publishing results.

    Every day you can read news articles about recent discoveries enabled by data science.

    Some examples of the common pitfalls of using data.

    Choosing the easiest model. Many platforms are making it extremely easy to import some data, run a model over the data, and report some results. With AI-enhanced data analytics platforms, anyone with a little IT knowledge and access to data can pick from a library of models and get some results. But how do you know whether a boosted tree or a neural network is the best model for your data?

    p-hacking

    Results before theory

    Multiple hypothesis testing